Introduction #
This article walks through developing your first dashboard in SmartChart from scratch. Covers dashboard creation, dataset editing, chart binding, drag layout, and theme application.
Due to version changes, some icons and interfaces may vary, but positions remain largely the same.
Workflow Overview #
New Dashboard → Add Chart Component (Drag/Grid) → Edit Dataset (SQL) → Edit Chart (ECharts Config) → Layout Adjustment → Apply Theme
Create Dashboard #
- In development mode, navigate to “Dev Management” -> “Dashboards” -> “Add Dashboard”

- Fill in the information and click “Save”
- Click to enter dashboard development, click the right-side edit button

- Enter the development menu, click the SC icon in the bottom right, and add a drag component from the popup menu (Note: drag layout is a PRO feature) If you prefer the free version, use grid components instead. See Layout Guide

Dataset Editing #
- Hover over the index number, click the “Dataset” icon in the menu

- Enter the following SQL, click “Save & Refresh”, then close the dataset editor
select H1 as heroname, sum(qty) as appearances from smartdemo2
group by H1
order by sum(qty) desc
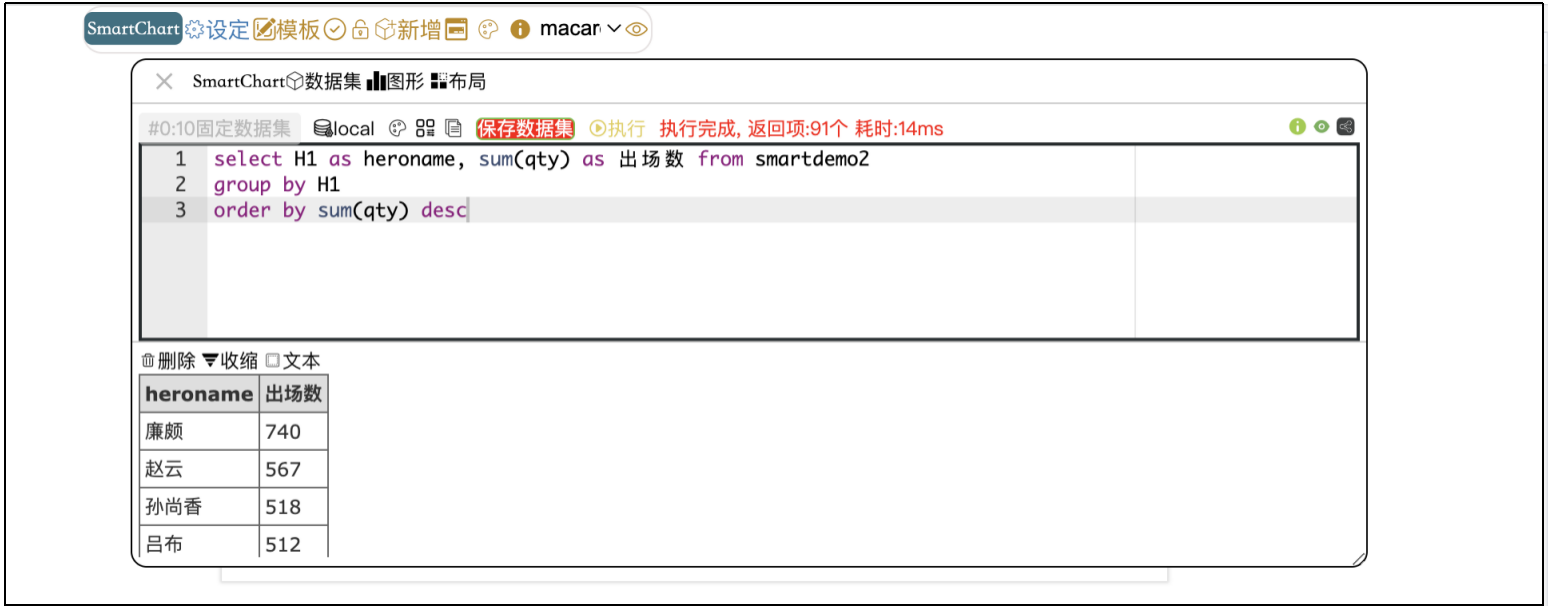
See Chapter 2 for dataset details. After saving, SmartChart caches the query result and passes it to the
__dataset__variable in the chart.
Chart Editing #
- Open “Chart Edit”

- Click “Charts”, select basic charts, and click to apply
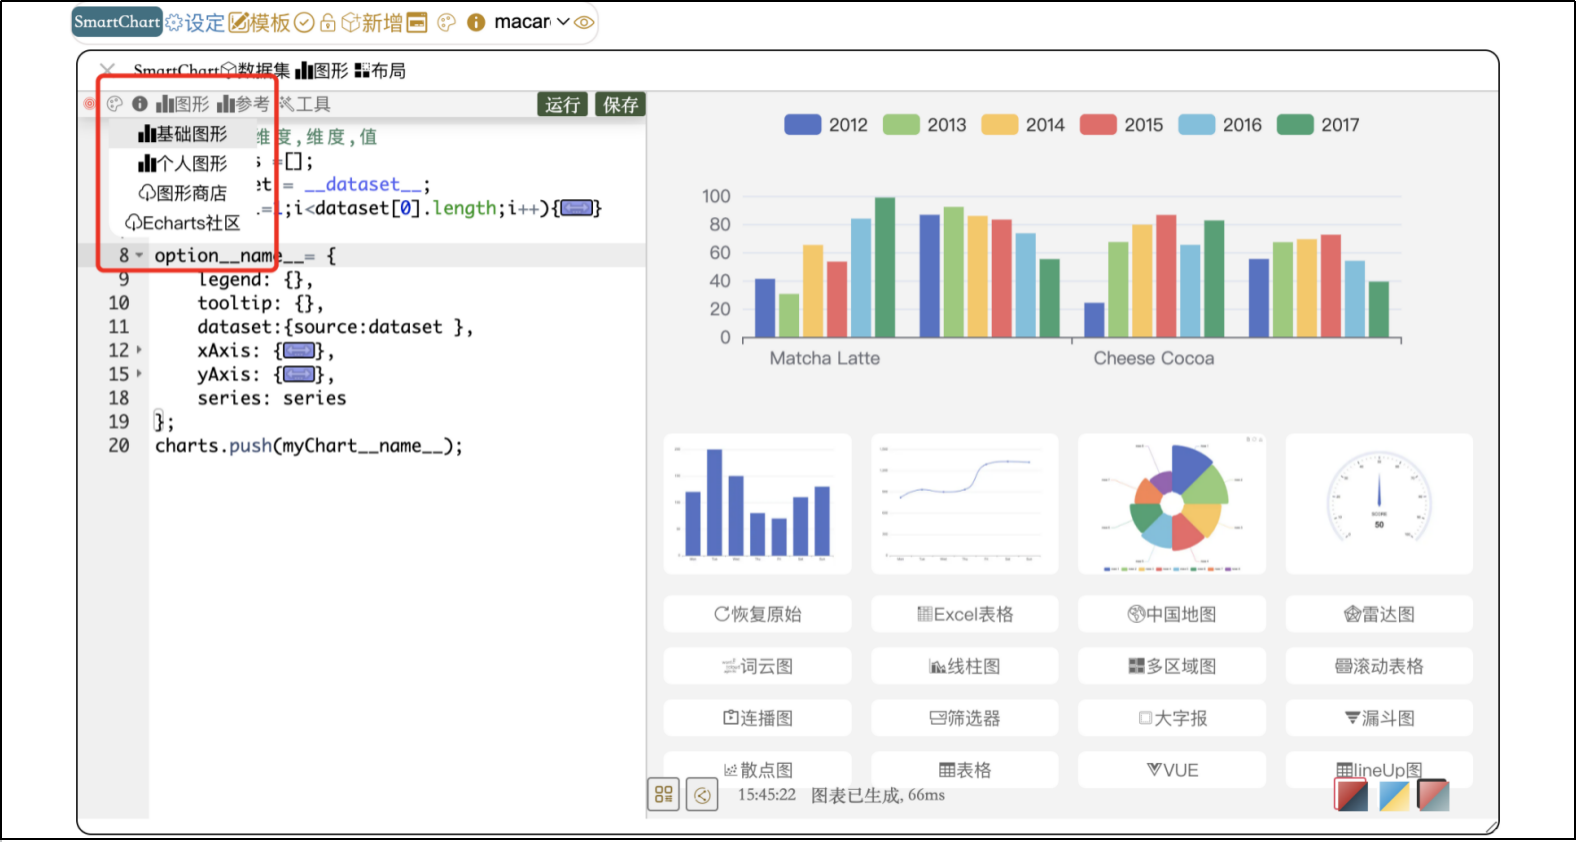
SmartChart uses ECharts option configuration + special placeholders (like
__dataset__,dom__name__) to drive data rendering. See Chapter 3 for chart development details.
Drag Layout #
- Repeat the above steps to add more components. You can drag them to different positions.
See Chapter 4 for layout details.
Theme Application #
- In the development interface, go to Settings to apply themes

Chart Theme Application #
- In the development interface, go to Settings to apply chart themes
