Introduction #
SmartChart provides a lightweight Python client that lets you use SmartChart’s visualization capabilities in Jupyter Notebook. With just two core commands (get / set), you can render ECharts in notebooks and persist visualization results directly to SmartChart dashboards.
Use Cases #
- Fetch data from SmartChart shared datasets for analysis in Jupyter
- Lots of offline data needing personalized analysis and dashboard creation
- Need quick chart generation during Jupyter data analysis
- Dashboard datasets requiring complex analysis
SmartChart supports usage in Jupyter like pyecharts, Matplotlib, etc. But it’s more convenient, cooler, and more universal - not just a drawing tool, but a platform
Features #
- Very simple to use, only two commands [get, set], native ECharts config, no learning curve
- Supports all ECharts features, highly customizable, can embed, popup, or display in dashboard
- Data can be persisted, use SmartChart Portal to build cool dashboards
Related Videos #
Installation #
Install SmartChart client in the same Python environment as Jupyter:
pip3 install /..../smartchart-xxx-py3-none-any.whl
# Use mirror for slow downloads
pip3 install -i https://mirrors.aliyun.com/pypi/simple  /..../smartchart-xxx-py3-none-any.whl

# Upgrade:
pip3 install /..../smartchart-xxx-py3-none-any.whl  -U
Quick Start #
Initialize Authentication: #
- First use requires setting default user and SmartChart server URL
- Same environment only needs initialization once
from smart_chart import Smart
Smart().set_auth('username','password',url = 'http://xxxxx')
- If SmartChart server is local, URL can be omitted:
Smart().set_auth('username','password')
Usage: #
from smart_chart import Smart
mysmart = Smart()
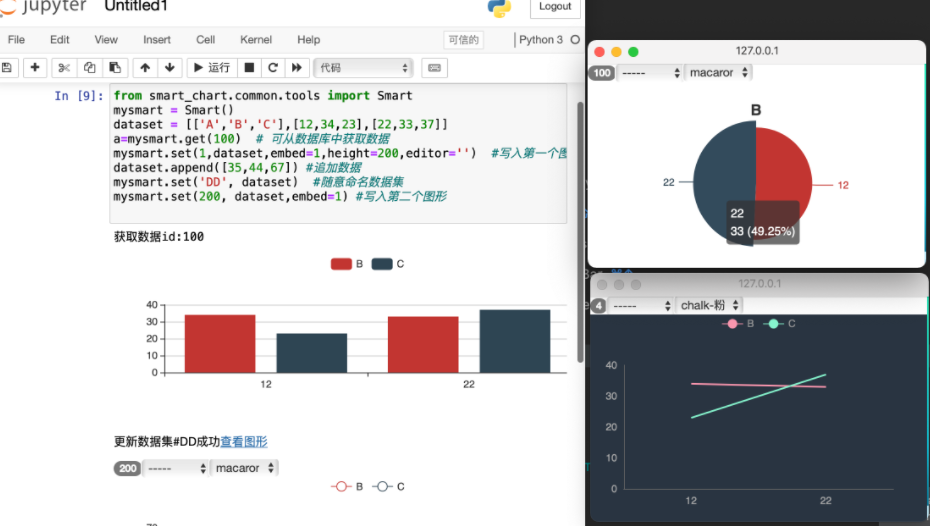
dataset = [['A','B','C'],[12,34,23],[22,33,37]]
# Write data to temp dataset and show chart (table format)
mysmart.set(1, dataset)
# Name temp dataset freely
mysmart.set('DD', dataset)

# Get data from existing dataset
ds1 = mysmart.get(1)
ds2 = mysmart.get('DD')
Modify Charts #
- Method 1: Select built-in chart or theme from chart menu
- Method 2: Default is table display, add prefix bar/line/pie to change:
mysmart.set('barxxx', dataset)   # Bar chart
mysmart.set('linexxx', dataset)  # Line chart
mysmart.set('piexxx', dataset)   # Pie chart
- Method 3: For custom ECharts, instantiate dataset:
mysmart.set('myds_1', dataset, push=1) # push=1 instantiates dataset
Instantiated datasets can be customized in chart editor with native ECharts config and real-time debugging

- Method 4: Use custom chart for temporary display If you’ve instantiated and customized a chart like ‘myds_1’:
# Without push, uses new data with myds_1's chart temporarily
mysmart.set('myds_1', dataset)
Display Parameters #
| Parameter | Description | Default |
|---|---|---|
width |
Chart embed width | - |
height |
Chart embed height | - |
embed |
Embed display | 0 (no) |
editor |
Show chart menu | 1 (show) |
push |
Persist dataset (overwrite if exists, create if not) | 0 |
# Global init
mysmart = Smart(width=800, height=400, embed=1, editor=0)
# Global settings
mysmart.url = 'http://ip:8000'
mysmart.embed = 1
# Per-chart settings
mysmart.set(1, dataset, embed=1, height=200, editor=0)
SmartChart & Pandas #
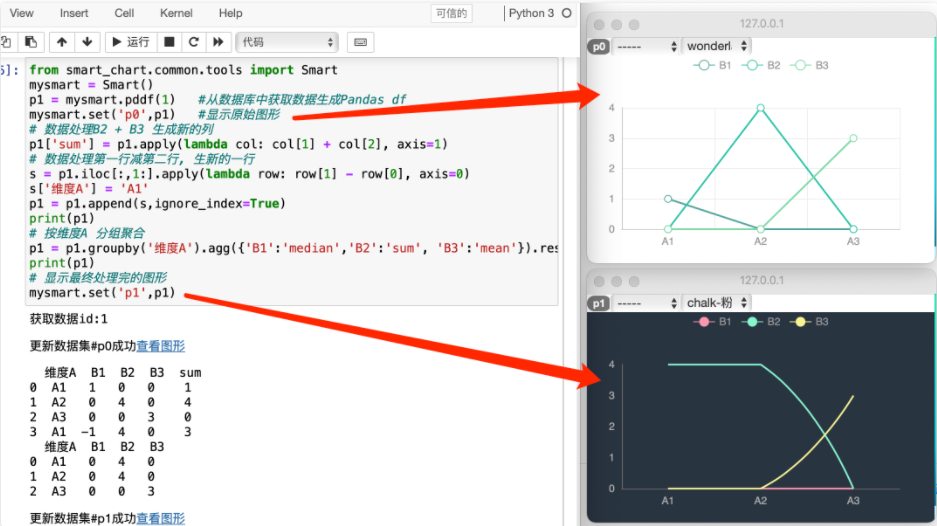
SmartChart’s set supports direct Pandas DataFrame input:
from smart_chart import Smart
import pandas as pd
mysmart = Smart()
df = pd.read_excel('manual_smartdemo.xlsx', 'sheet1')
mysmart.set('excelsample', df.sample(10))

df1 = df.groupby('province').agg({'qty':'sum'}).reset_index()
mysmart.set('ec_df1', df1, push=1)  # push=1 persist to SmartChart