Introduction #
“Complex Report” is SmartChart’s built-in Excel-like reporting feature that directly fills database query results into table cells while preserving table styles. Ideal for financial reports, statistical summaries, and other scenarios requiring detailed data display.
Create Dashboard #
- In development mode, navigate to “Dev Management” -> “Dashboards” -> “Add Dashboard”
- Fill in the information and click “Save”
- Click to enter dashboard development, click the right-side edit button
Create Excel Scene #
- Click the SC icon in the bottom right, then click the top-left Settings
- In Settings, select Excel template
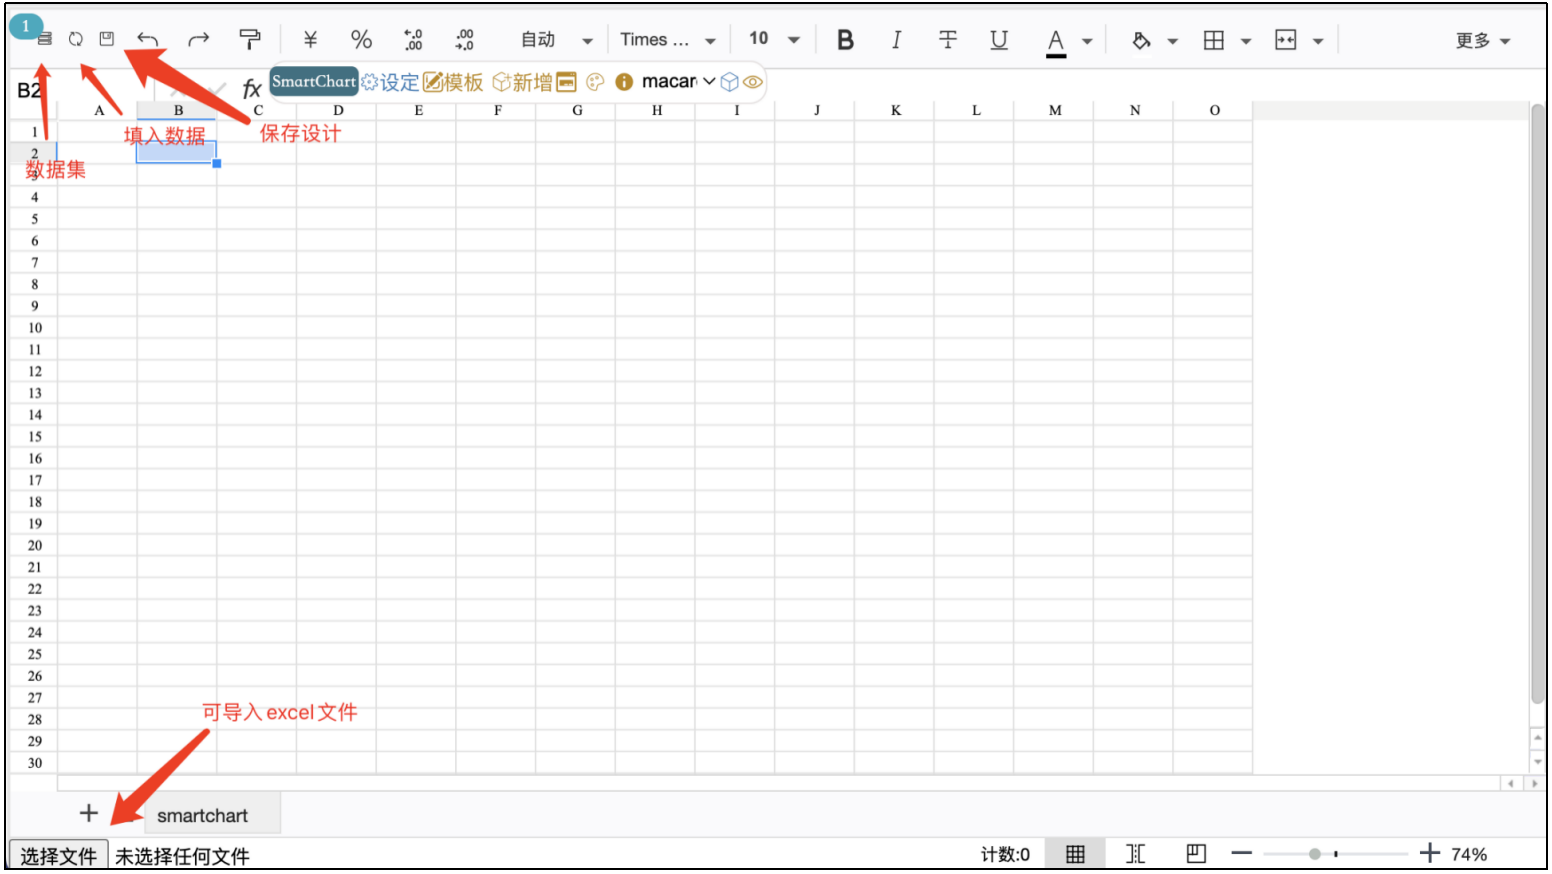
Dataset Editing #
- Open “Dataset”
- Enter the following SQL, click “Save & Refresh”, close the dataset editor
select H1 as hero_name, sum(qty) as hero1_appearances from smartdemo2
group by H1 order by sum(qty) desc;
select count(1) as total_appearances from smartdemo2
Multiple SQL statements separated by
;correspond todf0anddf1datasets respectively
Report Page Development #
- Edit the table like Excel
- Click the “Dataset icon” (click again to hide), show dataset field names, select a cell, and click a field name to fill in
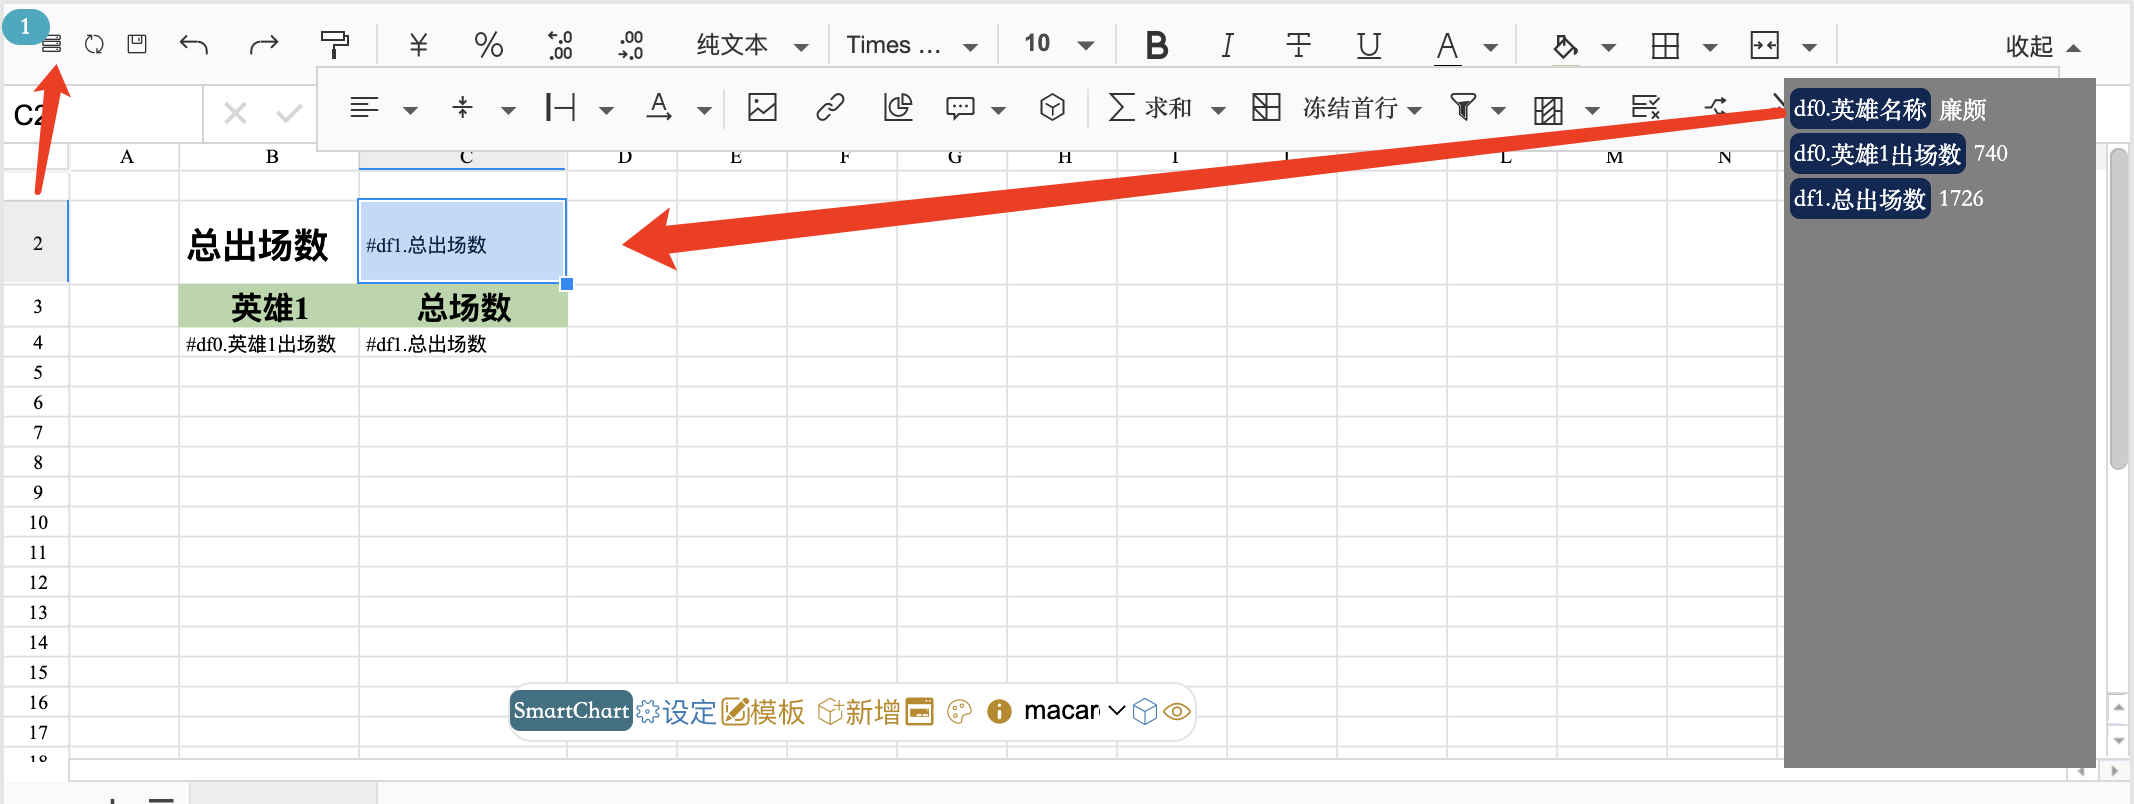
- Click “Get Data” to adjust styles with real data
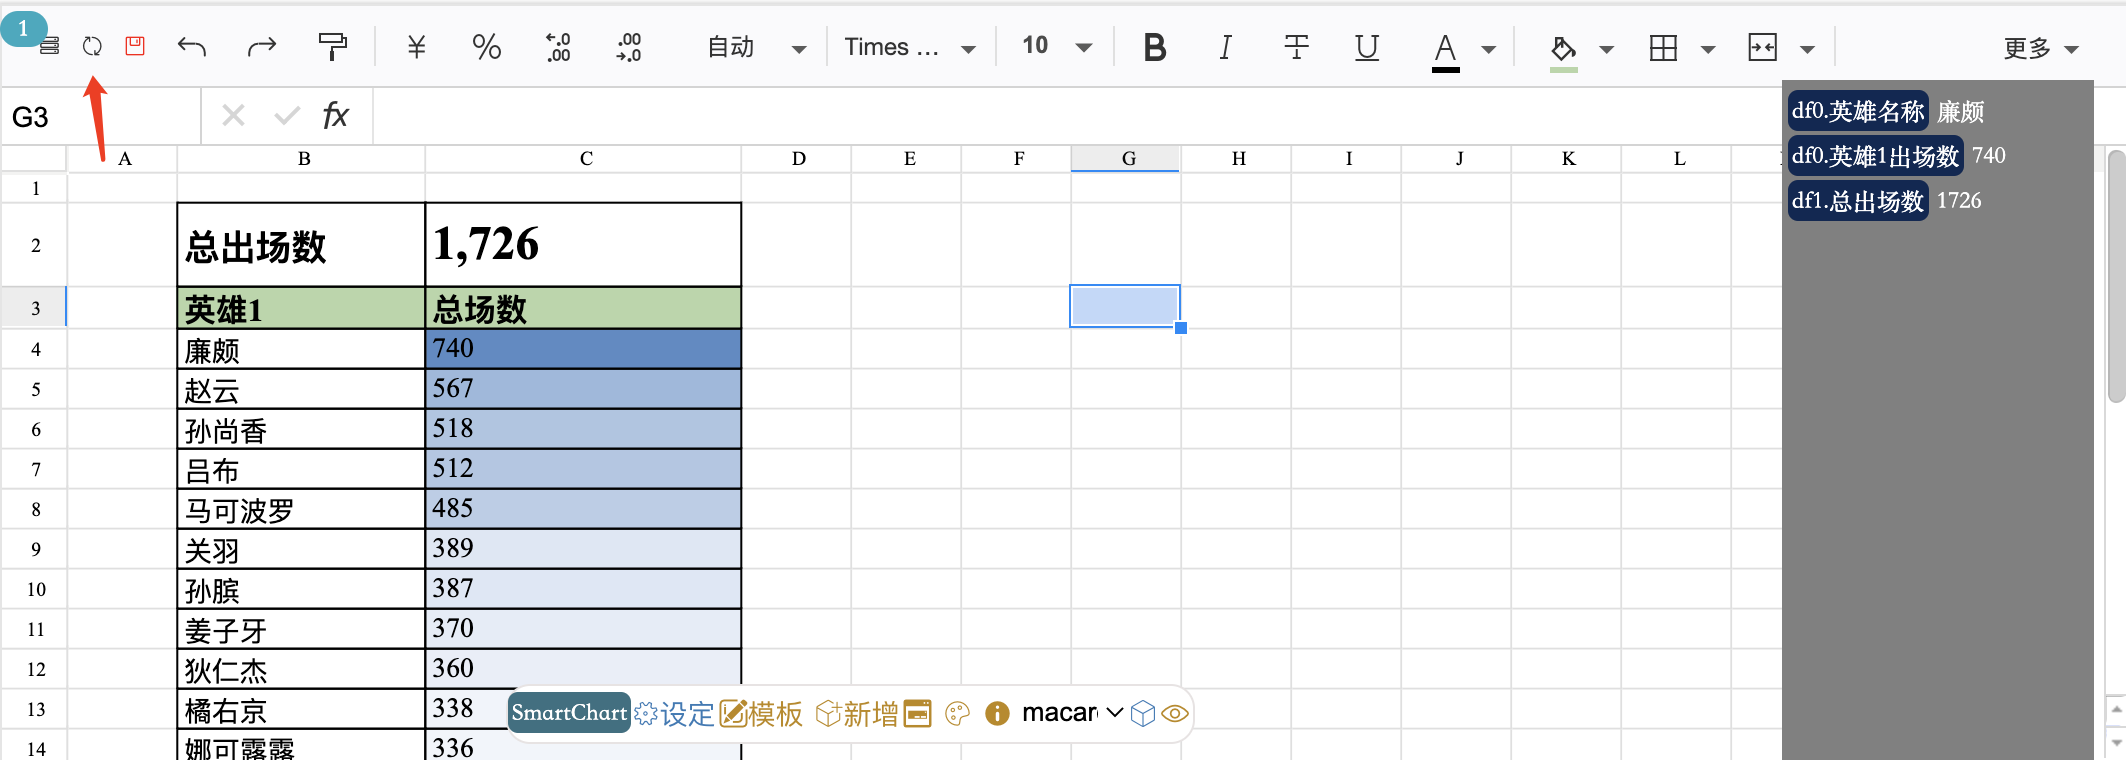
- Click “Save”
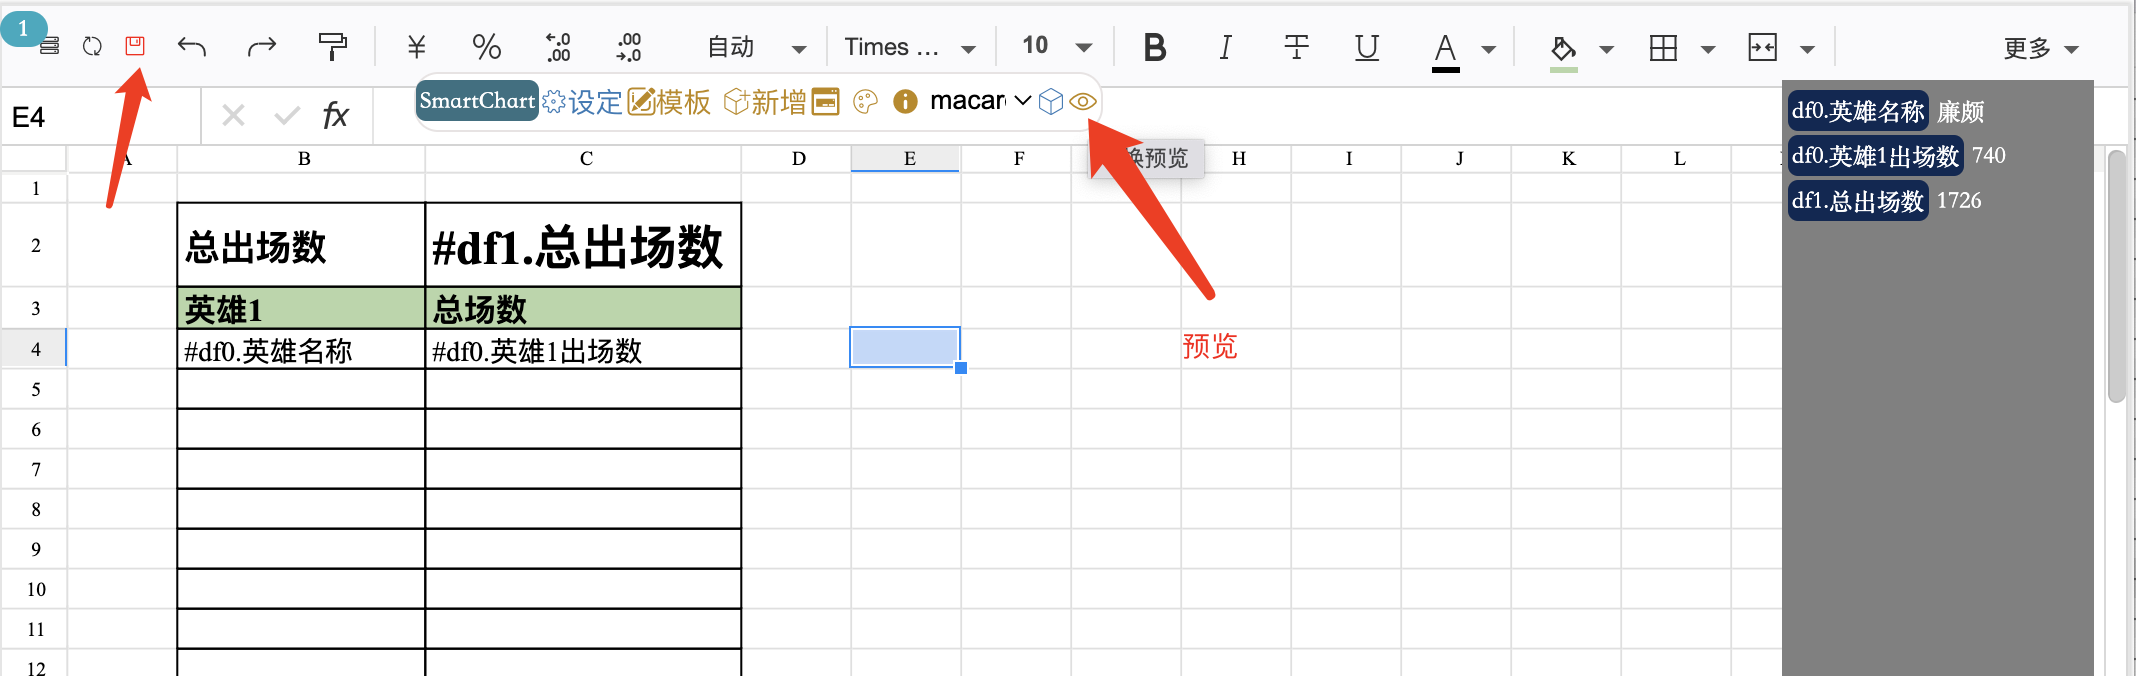
- Click “Preview” to see the final result
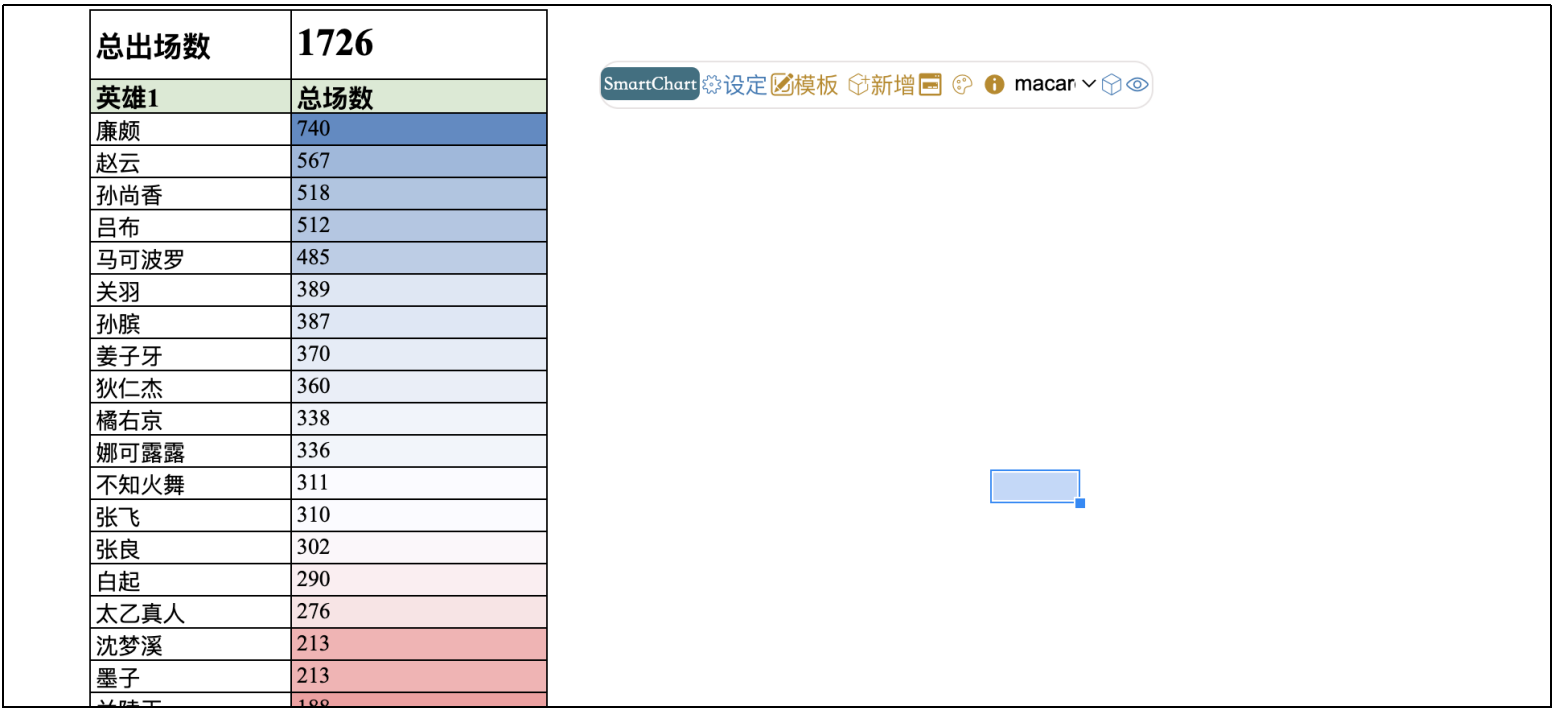
Import Excel/WPS Templates #
You can directly import Excel or WPS templates. Click the upload button in the bottom left.
Auto-fill Methods #
Cell Placeholder Syntax #
Enter placeholders in table cells in the following format. The system will auto-replace them with actual data during rendering:
#df_number.field_name         → Fill downward by column (default)
#df0.hero_name__             → Fill rightward by row (append __)
#df0.hero_name!              → Inherit cell field format (append !)
#df0.hero_name!__            → Both direction + format inheritance
Fill Direction #
Default fill direction is downward by column. To fill rightward by row, append __ after the field identifier:
#df0.hero_name__
Format Fill #
By default, format is not filled; the cell’s own format is used. To auto-apply the “cell field identifier” format, append ! after the identifier:
#df0.hero_name!
Format fill does not work in data preview, only in report preview and user mode
To modify both direction and format:
#df0.hero_name!__
Feature Overview #
SmartChart Excel supports:
| Feature | Description |
|---|---|
| Data Display | Bind dataset fields via #df placeholders, auto-fill data |
| Data Entry | Let users fill in and submit data via #input.field_name placeholders |
| Template Save | Save table layouts (with placeholders) as templates |
| Excel Import/Export | Import existing Excel files, or export as xlsx/csv |
Core Concepts #
Mode B: option.view — Display Style
#
Controls LuckySheet’s display:
| Value | Meaning |
|---|---|
true |
Clean view mode: hide toolbar, sheet bar, statistics bar |
false |
Full edit mode: show all toolbars |
Mode C: option.dev_mode — Data Loading Mode
#
| Value | Meaning |
|---|---|
true |
Dev mode: Keep #df/#input placeholders, load from stored table_data |
false |
Free mode: Auto-generate all cell data from dataset |
Placeholder Syntax #
#df — Data Field Binding
#
#df0.field_name        — Vertical fill (default)
#df0.field_name__      — Horizontal fill
#df0.field_name!       — Copy source cell format
#df0.field_name:N      — Fill at most N rows
Example:
// Vertical fill city field, max 10 rows
#df0.city:10

// Horizontal fill name field
#df0.name__

// Vertical fill, copy format
#df0.salary!
#input — User Entry Input Box
#
#input.field_name — Fill cell, submit with field_name as key
Example:
#input.username   // User fills and submits data { username: "user input value" }
#input.email      // User fills and submits data { email: "user input value" }
Toolbar Buttons #
Dynamically shows different buttons based on access mode:
| Button | Icon | Developer | Regular User |
|---|---|---|---|
| Import Excel | Folder | Y | - |
| Refresh Data | Refresh | Y | - |
| Data Fields | List | Y | - |
| Save | Save | Y | - |
| Submit Entry | Upload | - | Y (when #input exists) |
| Reset Entry | Refresh | - | Y (when #input exists) |
| Export | Download | Y | Y |
Submit Button Feature #
When #input cells exist and user is in view mode, the toolbar auto-shows a Submit Entry button.
Typical Examples #
Dev Mode (Entry Template Design) #
let dataset = __dataset__;
let options = {
    view: true,        // Clean display
    dev_mode: true,   // Dev mode
    allowEdit: true,  // Allow editing
};
ds_excel_upload('__name__', dataset, options);
User Mode (Data Display + Entry) #
let dataset = __dataset__;
let options = {
    view: true,        // Clean display
    dev_mode: true,   // Keep #df/#input placeholders
    allowEdit: true,  // Allow user to fill #input
    submitId: 1,      // ID for submit button (optional, default 1)
};
ds_excel_upload('__name__', dataset, options);
Pure Display Mode #
let dataset = __dataset__;
let options = {
    view: true,        // Clean display
    dev_mode: true,   // Dev mode
    allowEdit: false, // Read-only
};
ds_excel_upload('__name__', dataset, options);